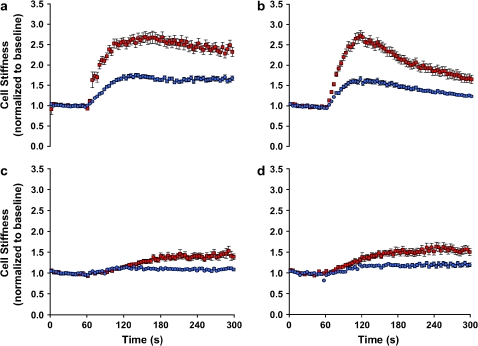
Figure 2.
Stiffness changes in response to a panel of contractile agonists. ASM cells isolated from the relatively hyporesponsive Lewis rat (blue closed circles) and the relatively hyperresponsive Fisher rat (red closed squares) were maximally stimulated with a panel of contractile agonists: (a) 5-HT (1 μM); (b) bradykinin (1 μM); (c) acetylcholine (1 μM); (D) carbachol (100 μM). For each agonist, changes in cell stiffness were normalized to the baseline stiffness of each individual cell before stimulation. For clarity, data are presented at intervals of 3.9 s. Data are presented as mean ± SE (n = 473–804 cells).

