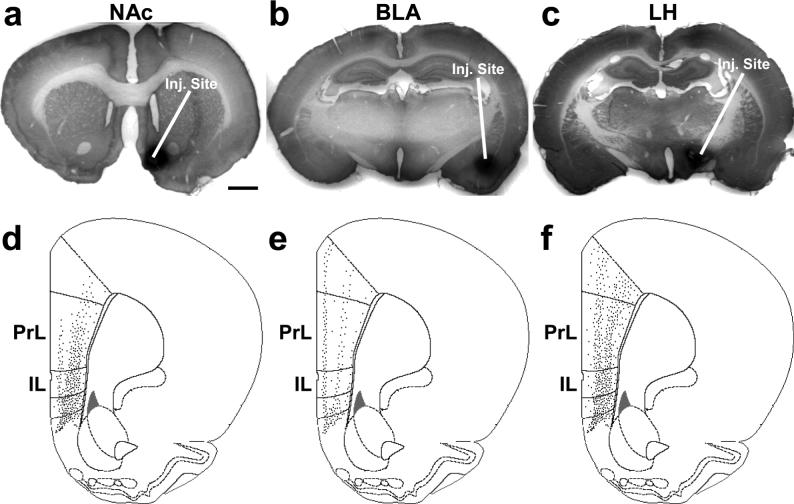
Figure 1.
Representative micrographs showing typical FG injection sites for the (a) NAc, (b) BLA, and (c) LH. Diagrams representing the corresponding ipsilateral areal distributions of neurons (black dots) in the mPFC retrogradely labeled from the (d) NAc, (e) BLA, and (f) LH (each drawing represents a coronal section at approximately +2.7 mm from bregma) (Paxinos and Watson 2005). FG injections centered in the (d) NAc and (f) LH produced similar dense distributions of retrogradely labeled neurons primarily in the deep layers of the IL and PrL, while injections centered in the (e) BLA labeled neurons in layer II and the deeper layers of the IL and PrL. Scale bars: a (also valid for b,c), 2 mm.

