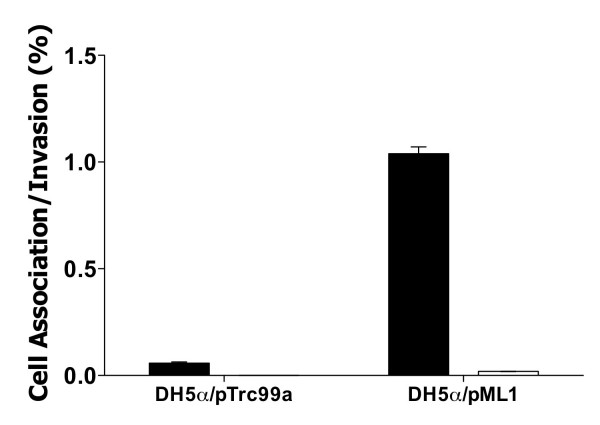
Figure 3.
Interaction of E. coli K-12 expressing PagN with HT-29 cells. E. coli DH5α harboring either pTrc99a or pML1 were induced with IPTG and incubated with HT-29 cells and cell association (black bars) and invasion (white bars) levels were measured. Percentage cell association and invasion were calculated as the viable number of bacteria after the assay as compared to the initial input inocula size. The strains tested are indicated. Data represents an average of triplicate wells and standard error bars are shown. Invasion by E. coli harboring the vector plasmid was not detectable in this assay.

