
Figure 3.
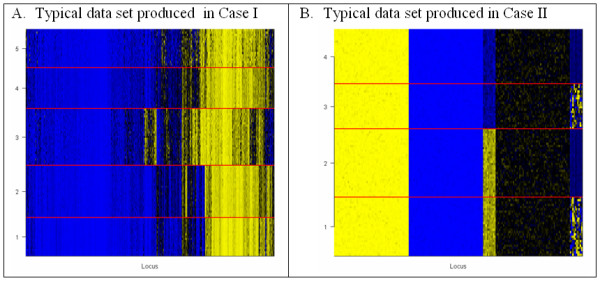
Examples of simulated data. Yellow = 1.0, black = 0.5, blue = 0.0. True classes indicated and separated by yellow dividing line. Height of region indicates the relative number of subjects in each class.
Official websites use .gov
A
.gov website belongs to an official
government organization in the United States.
Secure .gov websites use HTTPS
A lock (
) or https:// means you've safely
connected to the .gov website. Share sensitive
information only on official, secure websites.
Examples of simulated data. Yellow = 1.0, black = 0.5, blue = 0.0. True classes indicated and separated by yellow dividing line. Height of region indicates the relative number of subjects in each class.