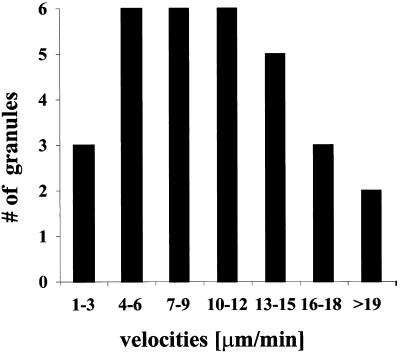
Figure 5.
Gaussian distribution of measured velocities of individual hStau-GFP particles. Cells were transiently transfected, and fluorescence recording was performed as described in Figure 4. The velocities of moving hStau-GFP particles were calculated from the distance traveled between two adjacent video frames. Forty-two velocities from 18 particles were analyzed by time-lapse video microscopy, the resulting velocities arranged in increasing intervals and plotted. The mean velocity was 11.5 μm/min.

