
Figure 5.
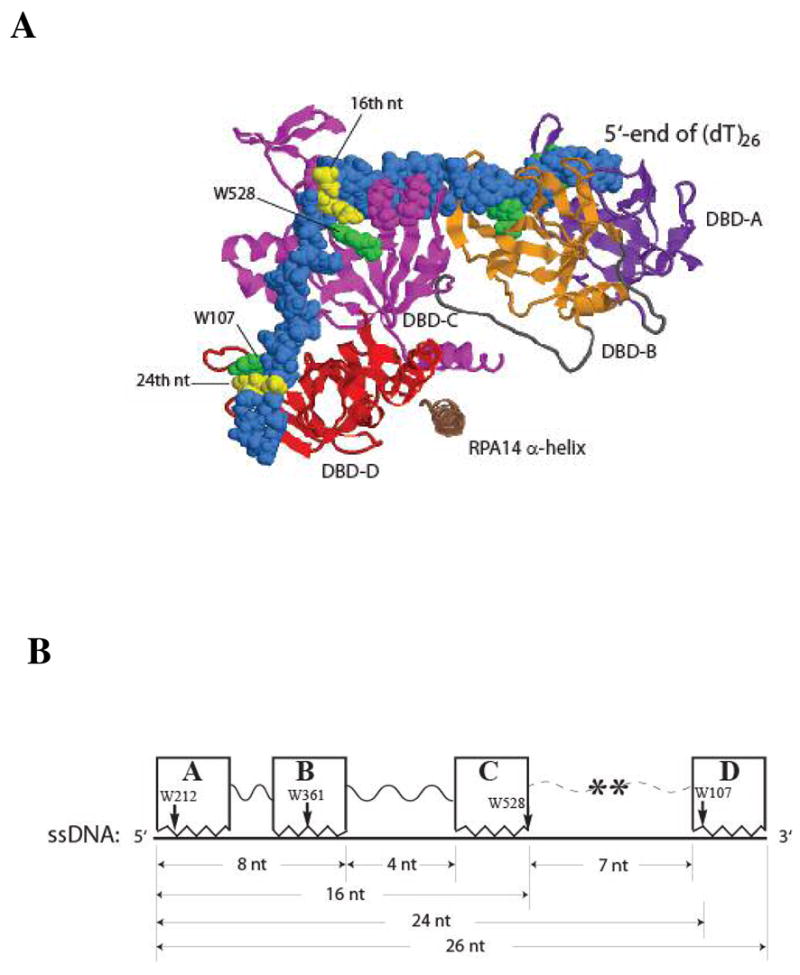
A structural model of RPA DBDs-ABCD-(dT)26 ssDNA complex formation. Panel A: the structures are displayed using RASMOL software (48), and were constructed based on our fluorescence spectroscopic data and the available domain structures of RPA (31, 35). The DBD-A, B, C, D domains are colored in purple, orange, magenta, and red, respectively. The α-helix of the RPA14 protein is colored in brown. The loops linking DBD-A and B, DBD-B and C are colored in grey. The ssDNA is colored in blue and displayed in space-filling format, with dT16 and dT24 in yellow. The four Trp residues that are presumed to interact with DNA are colored in green. Panel B: schematic representation of the dimension of RPA-ssDNA complex. The boxes A, B, C, and D represent DBD-A, DBD-B, DBD-C, and DBD-D of RPA, respectively. Both DBD-C and DBD-D have a ssDNA binding cleft of about 3 nt long, as derived from the domain structural data of RPA (31, 35). The ssDNA is plotted in thick line. The arrows indicate the relative positions of the tryptophan residues of individual DBDs in binding.