
Figure 12. RT-PCR showing the expression of SMVT in MDCK-MDR1 cells.
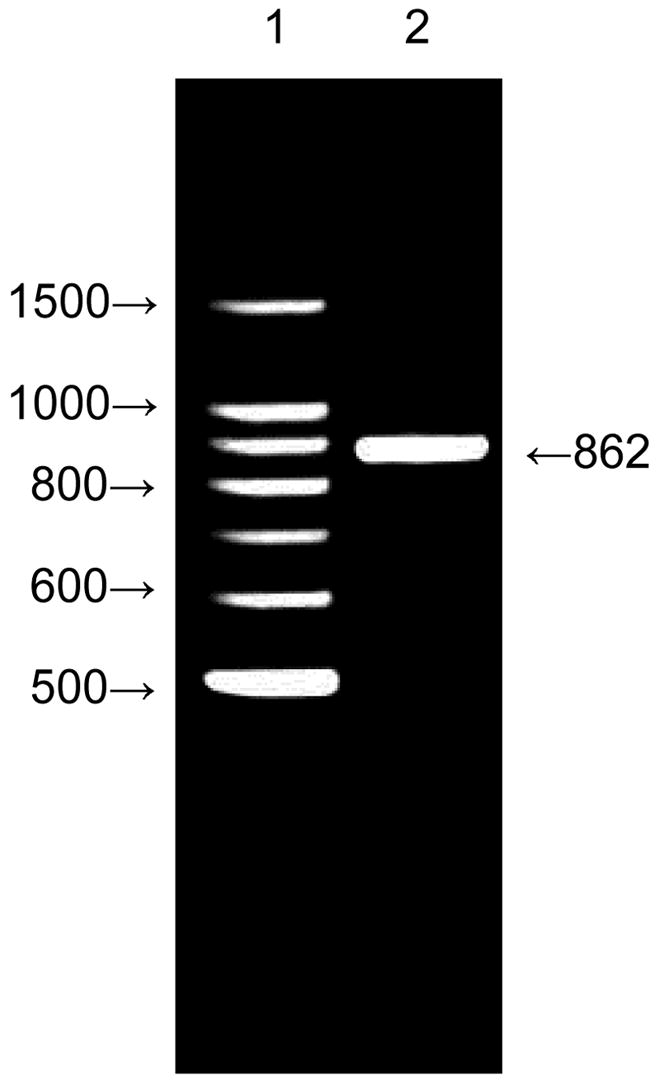
1: Standards; 2: PCR product obtained from total RNA isolated from MDCK-MDR1 cells with hSMVT-specific primers. Samples were analyzed on a 3% agarose gel. An 862 base pair band is very prominent.