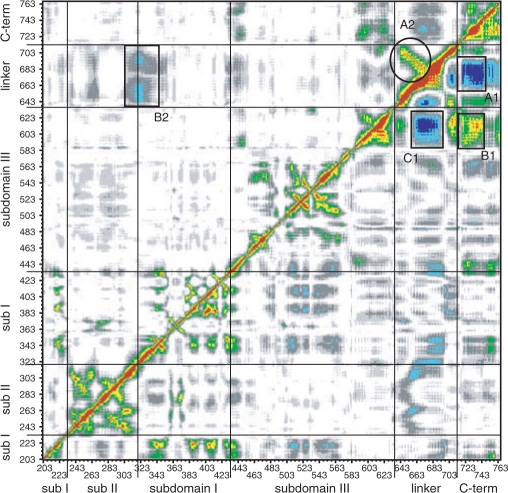
Figure 6.
Dynamic cross correlation map for the topo70 (lower right triangle) and Tyr729Pro mutant (upper left triangle). Correlated values with 0.50 ≤ Cij < 0.65, 0.65 ≤ Cij < 0.80 and 0.80 ≤ Cij < 1 are represented in green, yellow and red, respectively, while the anti-correlation values −0.80 ≤ Cij, <−0.65 and −0.65 ≤ Cij <−0.50 are represented in dark and light blue, respectively. The correlation range 0 ≤ Cij < 0.50 and the anti-correlation range −0.50 < Cij < 0 are represented in a grey scale depending on the absolute value of the correlation. The value 1, along the diagonal (correlation of the residue with itself), is represented in black.

