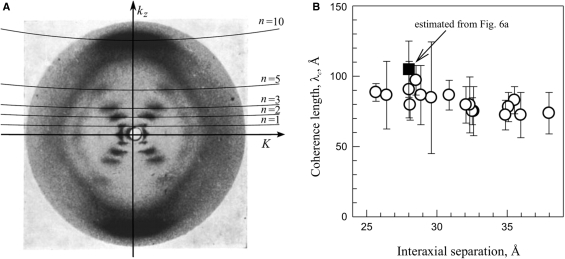
Figure 6.
(A) A typical diffraction pattern of hydrated DNA fibers (39) showing the layer lines. Imperfect vertical alignment results in broadening of these lines, but average tilt may be estimated from the width of the equatorial Bragg peak. (B) The helical coherence length extracted from experimental diffraction patterns taken from DNA fibers at different degrees of hydration (fiber density); open circles from data provided kindly by S. Zimmermann (16,38) and the filled square from the pattern shown in (A). The plotted values of λc were extracted by direct fitting of kz cross sections of n = ±5 peaks with Equation (13) without any corrections. The correction for the imperfect vertical alignment discussed in the text (‘Results’ section) increases estimated λc by 20–30% to 100–130 Å.

