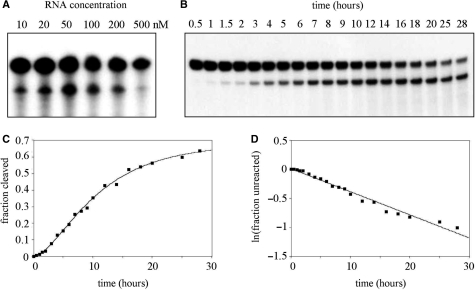
Figure 3.
Kinetics of the cleavage reaction. (A) A trace amount of internally labeled Vg1 RNA was added to the indicated concentration of unlabeled Vg1 RNA. The reactions proceeded in standard conditions overnight. (B) Vg1 RNA (100 nM) was incubated for the indicated amount of time in standard conditions. Reactions were stopped with EDTA and analyzed on a denaturing polyacrylamide gel. (C) The autoradiograph was scanned with a laser densitometer to generate the individual data points. The best-fit curve (solid line) is defined by a kinetic equation that represents a two-step process with both steps being first order. (D) The plot of ln(fraction unreacted) versus time yields an observed first-order rate constant of 6.6 × 10⁻⁴ min−1.

