Figure 1.
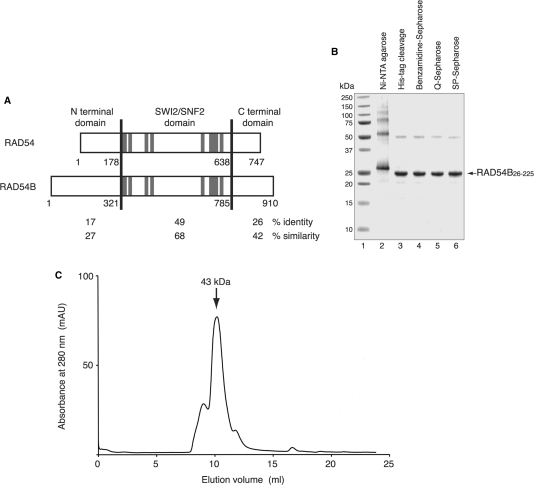
(A) Sequence comparison of RAD54 and RAD54B. These proteins are separated into three regions (N-terminal domain, SWI2/SNF2 domain and C-terminal domain), and the amino acid sequence identities and similarities between these proteins were calculated for each region. The amino acid number at the boundary of each domain is denoted. The gray lines indicate the seven helicase motifs (I, Ia, II, III, IV, V and VI, respectively). (B) Purification of the RAD54B26–225 protein. The peak fractions from the Ni-NTA agarose column (lane 2), the fraction after the removal of the His6 tag (lane 3), the Benzamidine Sepharose flow-through (lane 4), the Q-Sepharose flow-through (lane 5) and the peak fractions from the SP-Sepharose column (lane 6) were analyzed on a 12% SDS–PAGE gel, which was stained with Coomassie Brilliant Blue. Lane 1 indicates the molecular mass markers. (C) Gel filtration analysis of RAD54B26–225. The arrow indicates the peak location of a molecular weight marker, ovalbumin (43 kDa), which nearly corresponds to that of RAD54B26–225.

