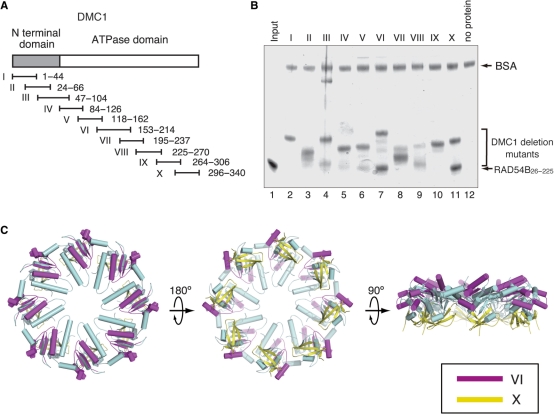
Figure 5.
(A) A schematic representation of the 10 overlapping GST–DMC1 fusion proteins. The gray bar indicates the N-terminal domain of DMC1, and the white bar indicates the core ATPase domain. (B) Protein–protein interaction assay of RAD54B26–225 with the DMC1 deletion mutants. The GS4B–DMC1 deletion mutant beads were first mixed with BSA, to prevent nonspecific protein binding, followed by the addition of RAD54B26–225. After an incubation at 4°C for 1 h, the GS4B–DMC1 deletion mutant beads were washed with binding buffer. The RAD54B26–225 proteins that bound to the GS4B–DMC1 deletion mutant beads were fractionated by 12% SDS–PAGE gel (lanes 2–11, respectively). Lane 1 is one-tenth of the input proteins, and lane 12 is the negative control experiment using the GS4B beads without the DMC1 deletion mutant. (C) The RAD54B26–225-binding sites mapped on the DMC1 octameric ring. The purple region indicates DMC1153–214, and the yellow region indicates DMC1296–340.

