Figure 1.
RD19 Is Required for RRS1-R–Mediated Disease Resistance Signaling.
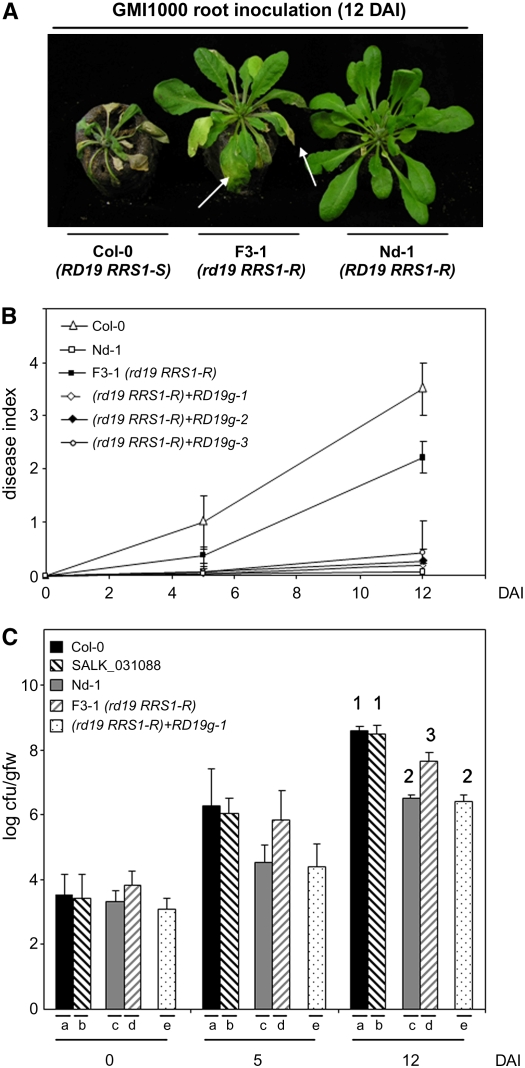
(A) Phenotypic responses of susceptible Col-0 (RD19 RRS1-S) and resistant Nd-1 (RD19 RRS1-R) wild-type Arabidopsis plants and of the rd19 RRS1-R (F3-1) line to the GMI1000 strain of R. solanacearum 12 DAI. Arrows point to wilted leaves of the mutant line.
(B) Disease symptom development curves. Each plant was scored at 0, 5, and 12 DAI of roots using a scale between 0 and 4: 0 = no wilting, 1 = 25%, 2 = 50%, 3 = 75%, and 4 =100% of leaves were wilted. Means and sd were calculated from scores of a total of 60 plants per genotype (from three independent experiments); triangle, Col-0 (RD19 RRS1-S); open square, Nd-1(RD19 RRS1-R); closed square, rd19 mutant (F3-1 line [rd19 RRS1-R]); open diamonds, closed diamond, and open circle, three independent complemented rd19 lines (RD19g1 to -3 in an rd19 RRS1-R background).
(C) Bacterial growth inside the plant was estimated as described before (Deslandes et al., 1998). Means of colony-forming units per gram of fresh weight (cfu/gfw) and sd were calculated from triplicates of three plants for each genotype (from three independent experiments). (a) Col-0 (RD19 RRS1-S), (b) SALK_031088 line (rd19 RRS1-S), (c) Nd-1(RD19 RRS1-R), (d) rd19 RRS1-R F3-1 line, (e) complemented rd19 line (RD19g1 in an rd19 RRS1-R background). Analysis of variance and multiple between-group comparisons (Bonferroni test) were used to analyze differences between ecotypes. Groups 1 (a and b), 2 (d), and 3 (c and e) are statistically different (P value of 0.05).

