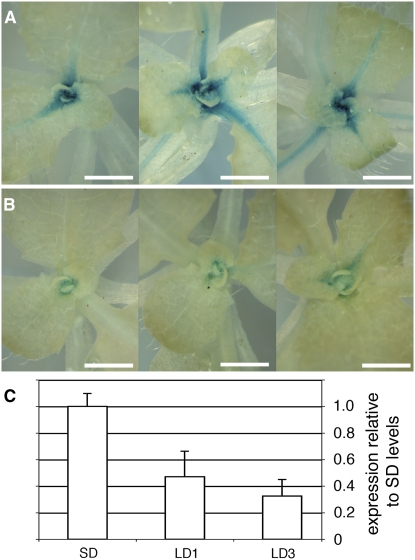
Figure 6.
ATH1 Is Downregulated at the Transition to Bolting.
(A) and (B) Expression of ATH1:ATH1-GUS in the shoot apex of three different plants grown for 33 d in short days (A) or for 30 d in short days followed by 3 d in long days to induce flowering (B). Bars = 1 mm.
(C) Expression of ATH1 measured by quantitative RT-PCR in plants grown for 33 d in short days (SD), 32 d in short days followed by 1 long day (LD1), or 30 short days followed by 3 long days (LD3). The vertical axis shows expression levels relative to the average of the SD treatment; the bars show averages ± sd for three independent RNA extractions (each from three to four whole rosettes).

