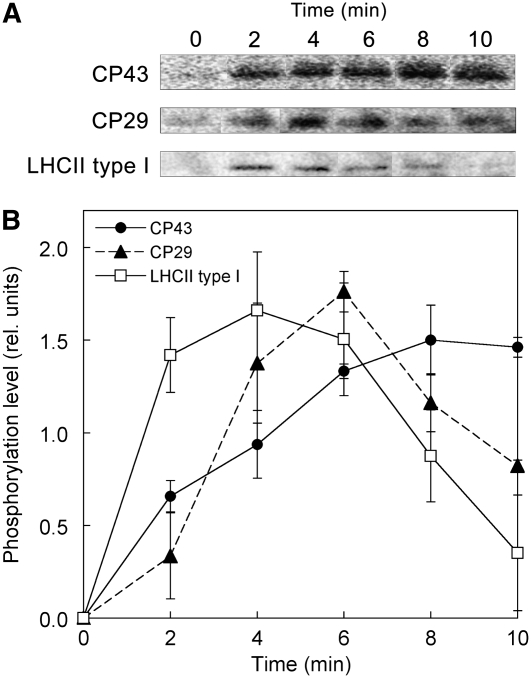
Figure 9.
Phosphorylation Kinetics in the Course of Transition from State 1 to State 2.
C. reinhardtii cells settled in State 1 under weak far-red light (720 nm) for 15 min were illuminated by weak blue light (467 nm) to induce a transition to State 2. Phosphorylated polypeptides in cells sampled at every 2 min were detected by immunoblotting with an antiphosphothreonine antibody (A), and kinetics of the relative phosphorylation levels are shown (B). Data represent an average of three independent measurements and are expressed as mean ± sd.

