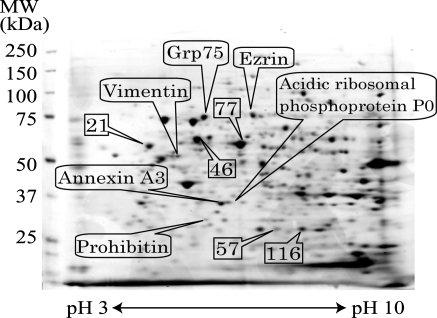
Fig. 3.
Statistically conferred protein spots. To confer expression intensity between control and NaB treated cells statistically, 198 spots were selected randomly. The spots, those intensity were used as standard, were shown as the number. The proteins down-regulated by NaB treatment were identified by Mascot search

