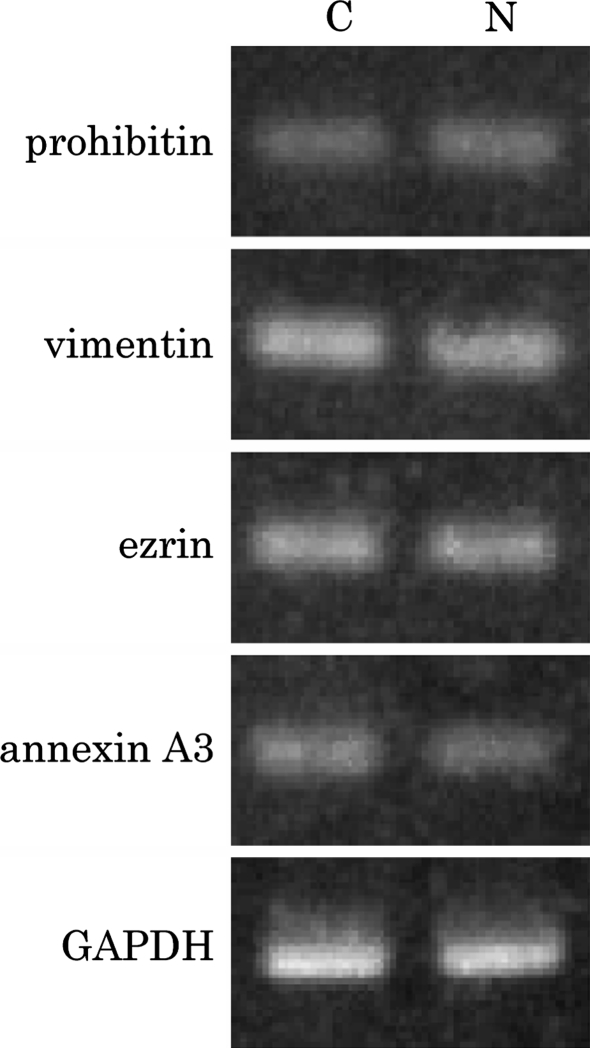
Fig. 4.
Expression of mRNA for prohibitin, vimentin, ezrin and annexin A3. Total RNAs were extracted from control HSL cells (C) or NaB treated HSL cells (N). RT-PCR data are representative of three separate experiments. The sizes of the amplified bands of prohibitin, vimentin, ezrin and annexin A3 were about 200 bp as expected. The GAPDH mRNA as control was amplified about 550 bp. No significant differences were observed between control and NaB treated HSL cells

