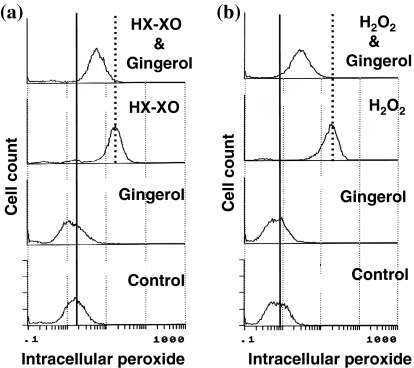
Fig. 5.
Flowcytometric analysis of intracellular peroxide in AH109A cells treated with exogenous reactive oxygen species (ROS) and [6]-gingerol. AH109A cells were treated with HX–XO (a) or 50 μM of hydrogen peroxide (H2O2) (b) as ROS resources. After ROS treatment for 4 h, DCFH-DA was added at a final concentration of 64 μM and the cells were incubated for 20 min. Basal and ROS activated intracellular peroxide levels were indicated as solid and dotted lines, respectively. Data are from a representative experiment repeated three times with similar results

