Fig. 3.
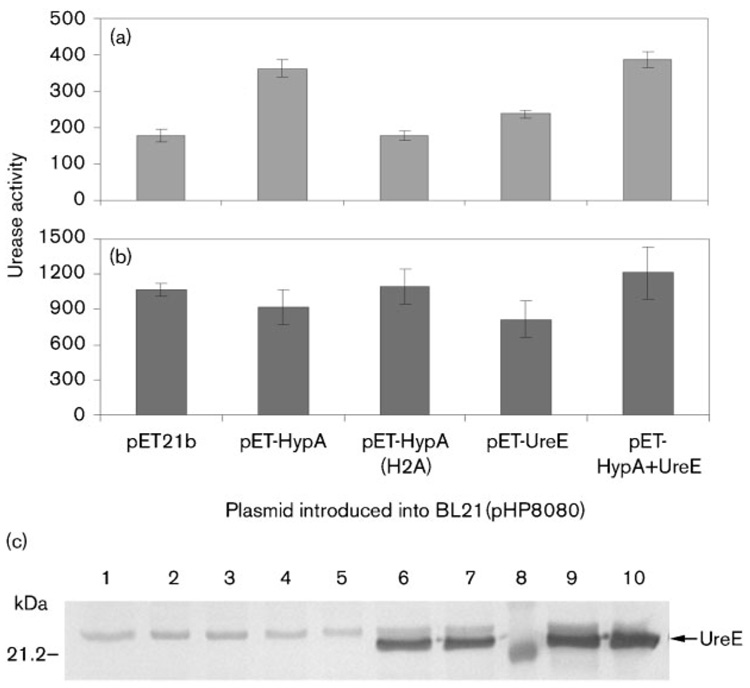
(a) and (b) Urease activity in E. coli cells harbouring plasmid pHP8080 and a pET-derivative plasmid. Results shown are representative of one experiment and three replicates. Cells were grown overnight in M9 minimal medium with (a) no nickel added to the medium or (b) 1 µM NiCl2 added to the medium. (a) The urease activities obtained with pET-HypA, pET-UreE or pET-HypA+UreE were significantly greater (P<0.05) than the pET21b or pET-HypA(H2A) results. Urease activities are expressed as nmol ammonia produced min−1 (mg total protein)−1. (c) Immunoblotting of UreE. Ten micrograms of total protein from E. coli BL21(pHP8080) grown without nickel (lanes 2, 4, 6 and 9) or with 1 µM NiCl2 (lanes 1, 3, 5, 7 and 10) was loaded onto each lane. The second plasmid present in the cell was either pET21b (lane 1), pET-HypA (lanes 2 and 3), pET-HypA(H2A) (lanes 4 and 5), pET-UreE (lanes 6 and 7) or pET-HypA+UreE (lanes 9 and 10). A molecular mass marker was loaded on lane 8, with the size of one of the markers indicated on the left. The position of UreE is indicated by an arrow. A non-specific band can be seen in all lanes.

