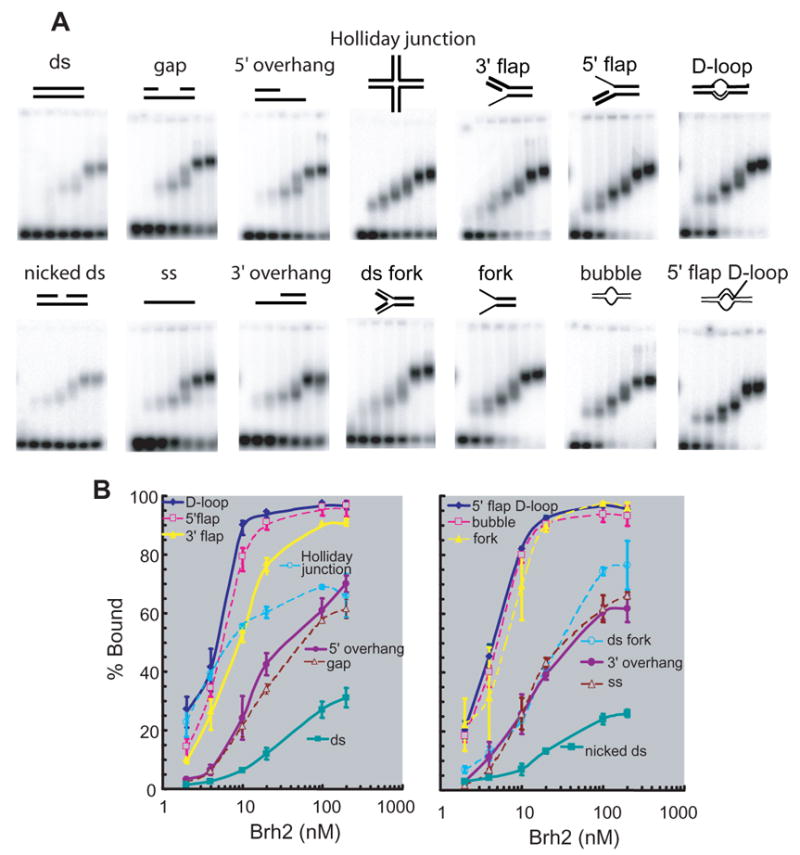
FIGURE 2. Specificity of Brh2 in DNA binding.

(A) Reactions containing oligonucleotide substrates shown schematically and increasing concentrations of Brh2 (samples from left to right in each frame: 0, 2, 4, 10, 20. 100. 200 nM) were incubated for 10 min, then analyzed by gel electrophoresis as described in EXPERIMENTAL PROCEDURES. Samples were run in triplicate but a single representative is shown. The sample with the 3′ flap substrate ran crooked and the image was straightened using Photoshop software. (B) The level of substrate shifted relative to the total signal in the lane was determined and is shown graphically. For clarity the substrates are listed in order according to their binding affinity and are divided arbitrarily into two groups arranged so that all curves are visible. The left-hand figure contains the data represented in the upper panel of mobility shift assays (A), while the right-hand figure contains the data represented in the lower panel.
