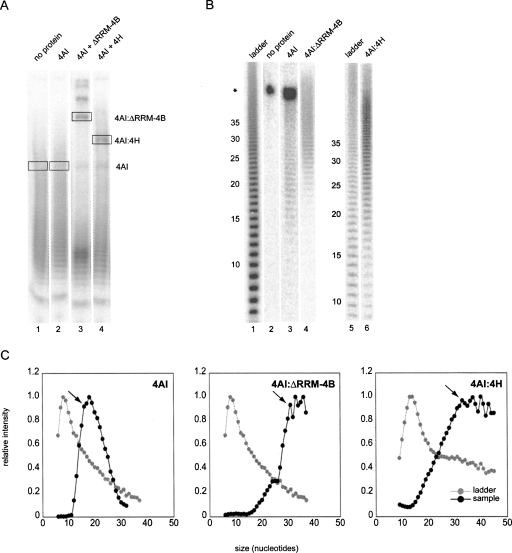
FIGURE 4.
Preferred RNA binding site sizes of eIF4AI complexes. (A) Representative EMSA of reactions containing 32P-labeled poly(U) hydrolysis ladder, AMPPNP (1.5 mM), and indicated proteins (1 μM). (Boxes) Gel slices excised for subsequent denaturing analysis. (B) Representative denaturing PAGE of RNAs recovered from slices such as those indicated in A, alongside the hydrolysis ladder used in that experiment (lanes 1,5). (*) Nonshifted bands comigrating with 4AI complexes. (C) Plots of relative band intensities versus RNA fragment length for hydrolysis ladders (gray circles) and indicated complexes in panel B (black circles). Minimum preferred RNA length is indicated by arrow.

