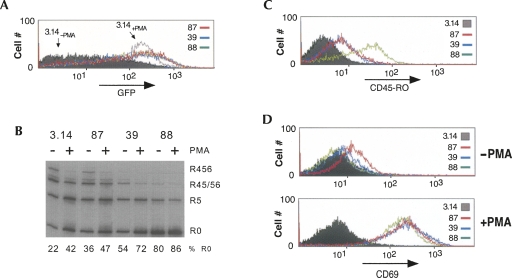
FIGURE 2.
Individual clones show activated pattern of CD45 splicing without up-regulation of general activation markers. (A) Flow cytometry analysis of GFP expression in isolated resting clones compared with that in resting (−PMA) or stimulated (+PMA) 3.14 cells. (B) RT–PCR analysis of splicing of the endogenous CD45 gene in 3.14 cells and clones. Quantitation of R0 isoform relative to total CD45 RNA is indicated. This and all other quantification in this study are derived from at least two to three independent experiments with deviations of <l15% of average value. (C) Flow cytometry analysis of CD45R0 expression in isolated clones compared with that in 3.14 cells, all under resting conditions. (D) Flow cytometry analysis of CD69 expression in clones versus 3.14 cells grown under resting or stimulated conditions.

