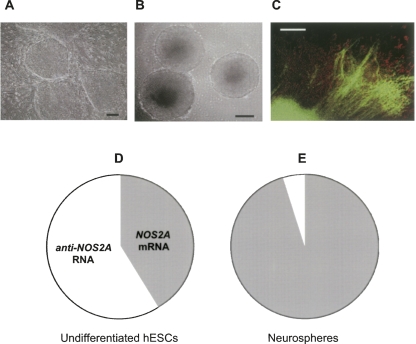
FIGURE 3.
The results of real-time RT-PCR performed on hESCs. (A) Colonies of hESM01 on the feeder layer of mouse embryonic fibroblasts. Scale bar represents 200 μm. (B) Neurospheres derived from hESM01 grown in suspension for 1 wk. Scale bar represents 200 μm. (C) Immunohistochemical analysis of differentiating neurosphere derived from hESM01. Cells were stained with antibodies against human NSE (green) and GFAP (red). Scale bar represents 200 μm. (D, E) Circular diagrams illustrating the ratio between relative levels of NOS2A mRNA (gray sectors) and anti-NOS2A RNA (white sectors) expression in undifferentiated hESM01 (D) and in neurospheres (E) derived from hESM01. The ratios were calculated as  .
.

