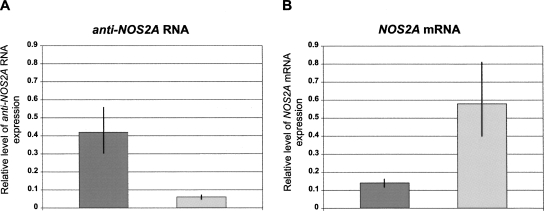
FIGURE 4.
The expression profiles of the anti-NOS2A RNA and the NOS2A mRNA exhibit concurrent reciprocal changes in undifferentiated hESCs and in hESCs induced to differentiate into neurospheres. (A, B) The relative levels of anti-NOS2A RNA (A) and NOS2A mRNA (B) expression normalized to an endogenous control (GAPDH) and relative to a calibrator in undifferentiated hESM01 (dark gray bars) and in neurospheres derived from hESM01 (light gray bars).

