
Fig. 2. Dot blot analysis of AAV-Del-1 gene copies.
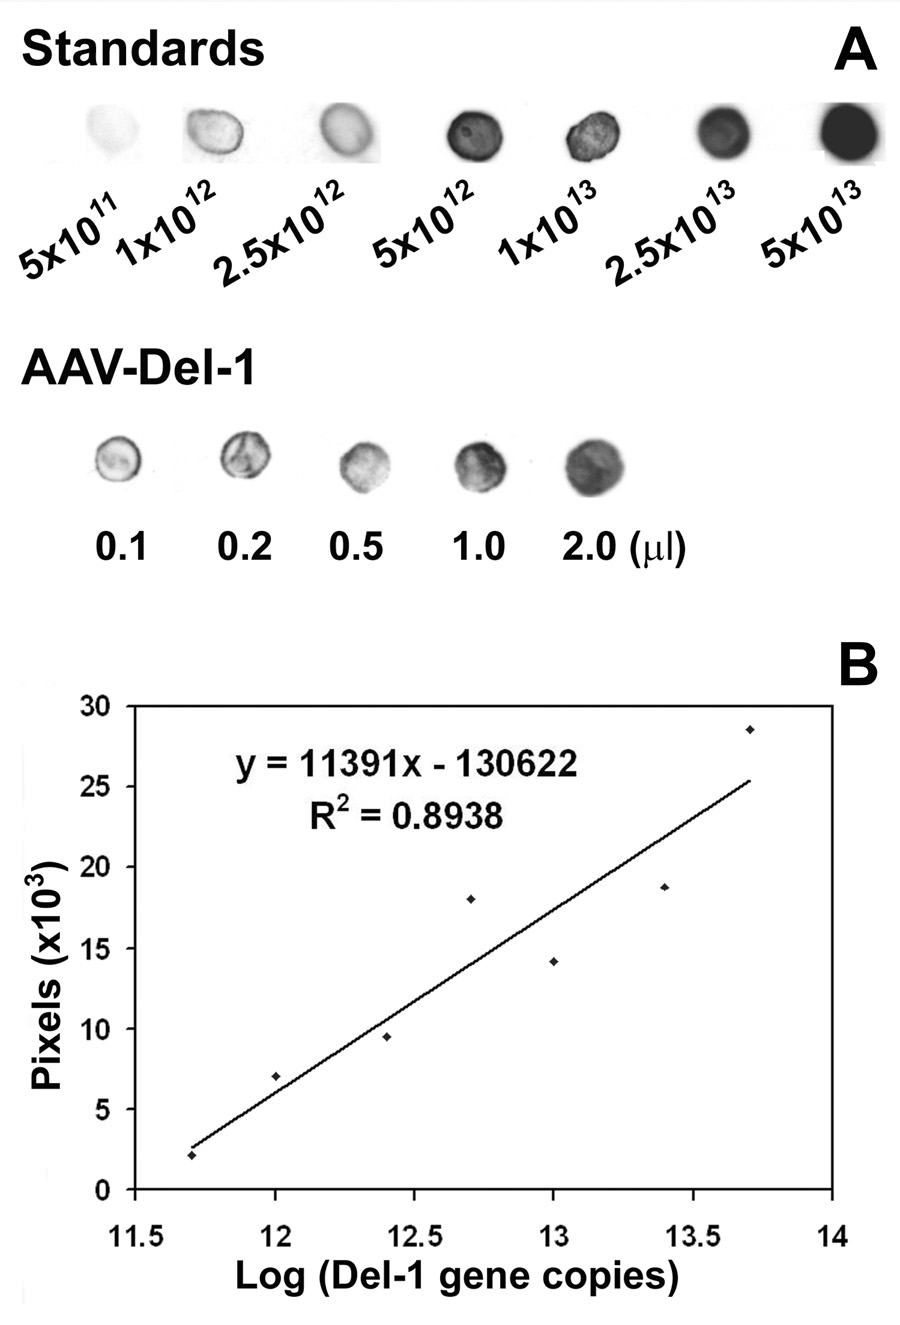
A. Photomicrograph shows AAV-Del-1 titers using dot blot hybridization. Del-1 gene fragment was amplified by PCR and used as standards. Upper panel in A shows the intensities of dot blot increases with the loading doses of the standards. Low panel in A is a representative blot image of AAV-Del-1 with different loading doses. After hybridization and exposure, the real pixels of dots were measured using software Image J. B. Standard curve, X-axis is log scale of gene copy, and Y-axis is linear scale of pixels. We obtained AAV-Del- 1 of 1.4×10¹³ /ml.