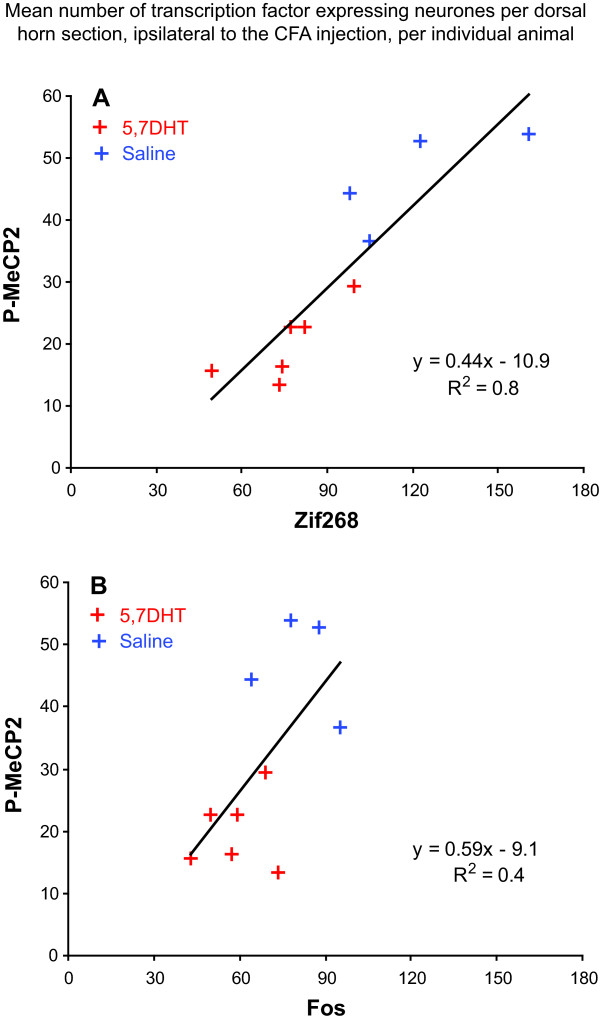
Figure 8.
The correlation between P-MeCP2 and Zif268 regulation is stronger than that between P-MeCP2 and Fos. The graphs represent the mean number of Zif268 (A) or Fos (B) expressing neurones per dorsal horn section, ipsilateral to the CFA injection, per individual animal, against the number of P-MeCP2 immuno-positive neurones. The correlation is considerably stronger between P-MeCP2 and Zif268 (correlation coefficient: R2 = 0.8) than that between P-MeCP2 and Fos (R2 = 0.4), suggesting a parallel regulation for P-MeCP2 and Zif268.

