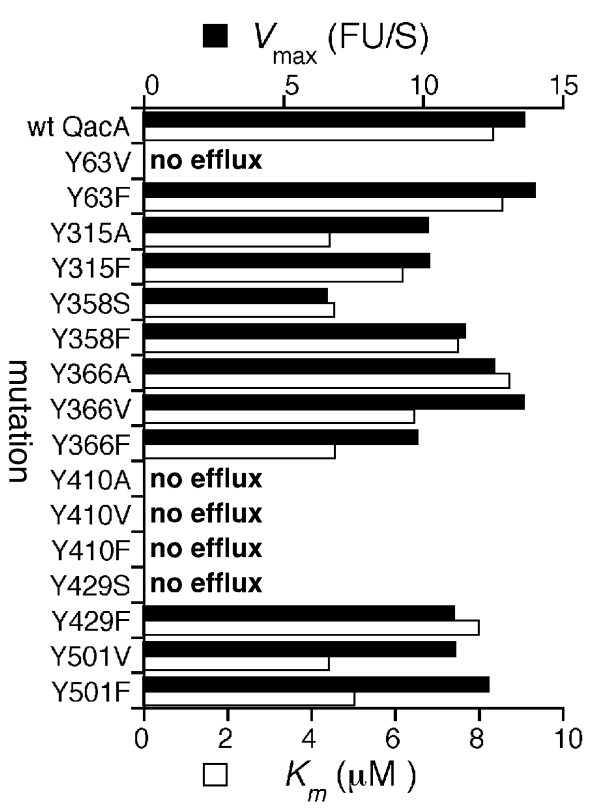
Figure 2.
Kinetics of ethidium transport by QacA tyrosine mutants. Cells expressing each QacA derivative were loaded with various concentrations of ethidium and efflux monitored fluorimetrically after energisation. Vmax values (black bars) represent the maximal change in fluorescent units per second (ΔFU S-1) and Km values (white bars) are presented as μM ethidium. Transport assays were conducted in at least triplicate and the results of a representative experiment are shown.

