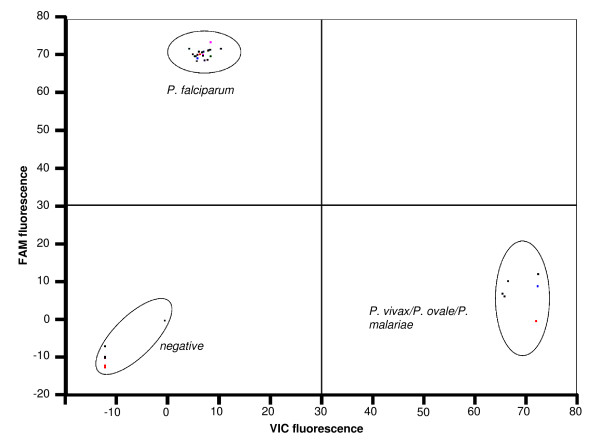
Figure 4.
Scatter plot analysis of TaqMan fluorescence data. In this example the TaqMan assay was carried out on ~30 Plasmodium genomic DNA samples and five no template negative controls. Fluorescence values of the FAM labelled probe specific for P. falciparum were plotted against those of the VIC labelled probe specific for P. vivax, P. ovale and P. malariae.

