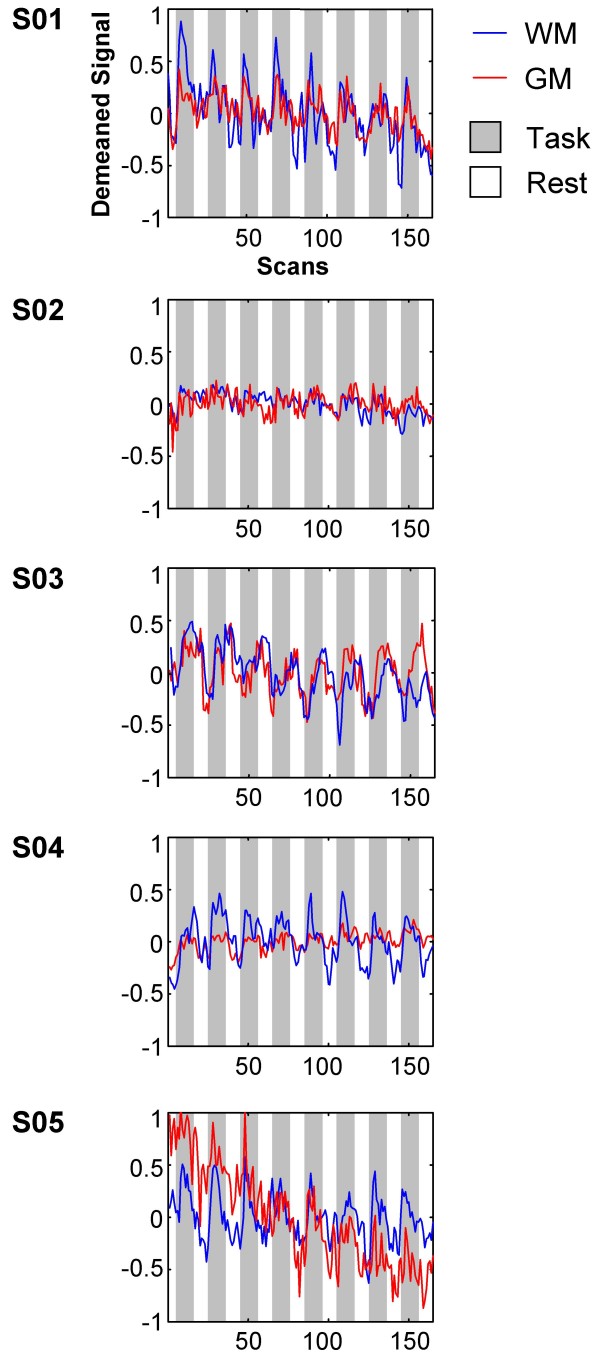
Figure 3.
Time course of corpus callosum activation. Time course signals were extracted from the activated clusters that were located primarily on the corpus callosum, excluding gray matter voxels and voxels with significant movement related activity (see text and Figure 2). For comparison, time course signals were also extracted from similar gray matter clusters (Table 1). Scans (x axis) represent 2 s intervals (effective TR). Signals were extracted from all four sub-runs and demeaned to account for global signal differences. The sub-runs were averaged together for each subject. WM: white matter, GM: gray matter.

