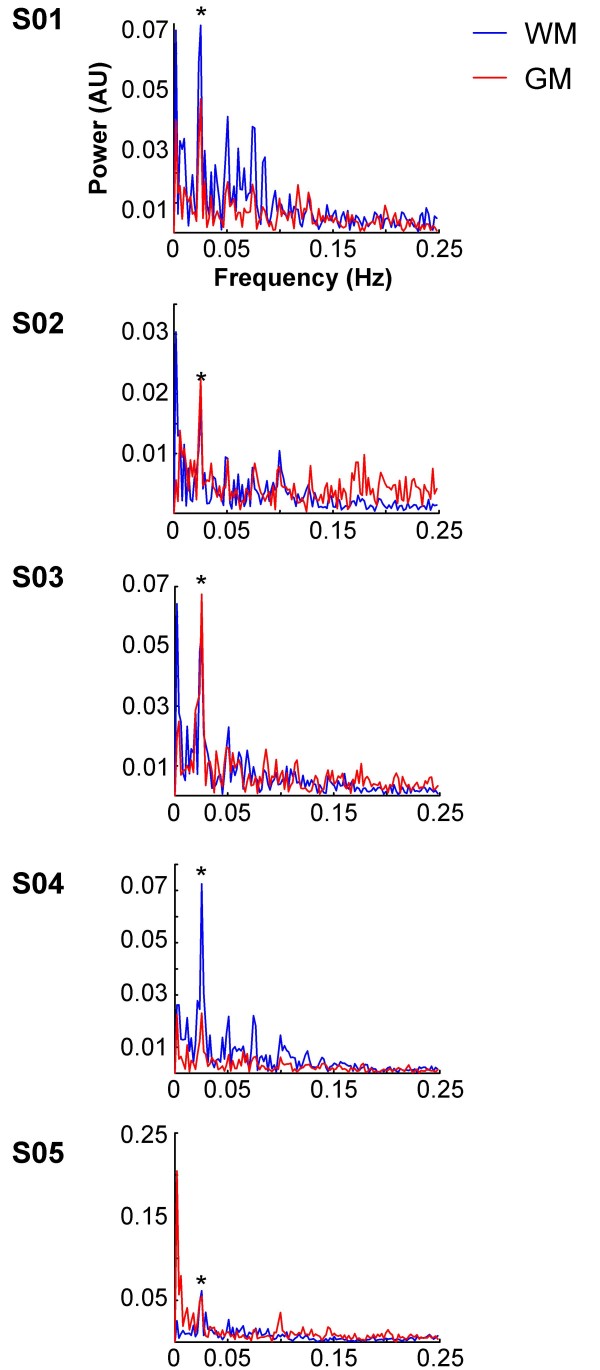
Figure 4.
Frequency spectra. Frequency spectra were created from the time courses (Figure 3) using FFT. Power (in arbitrary units [AU]) is on the y axis and frequency (in Hz) is on the x axis. Note the peak in the power spectra at the task frequency (0.025 Hz) for both gray and white matter (asterisks). WM: white matter, GM: gray matter.

