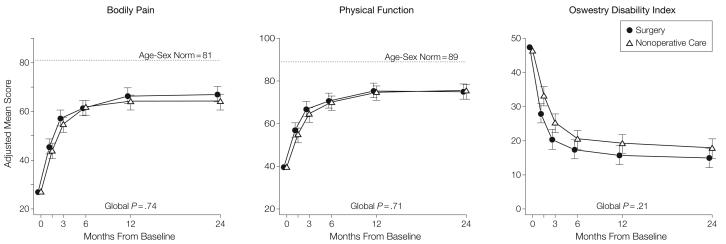
Figure 2. Mean Scores Over Time for SF-36 Bodily Pain and Physical Function Scales and Oswestry Disability Index.
Age- and sex-weighted population normative scores are plotted for Medical Outcomes Study 36-Item Short-Form Health Survey (SF-36) scales. To enhance readability, the plot symbols and error bars for the surgical group are slightly offset. Error bars indicate 95% confidence intervals.

