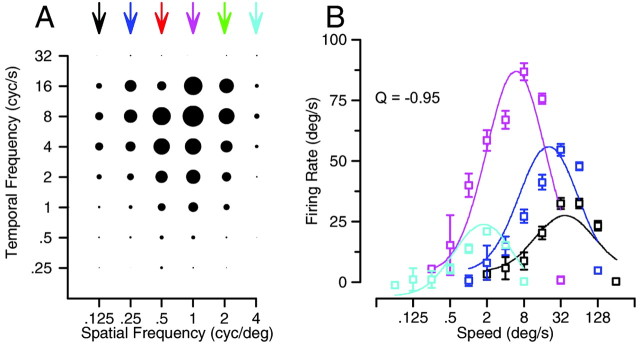
Figure 5.
Effect of spatial frequency on the preferred speed of an example MT neuron chosen to indicate one extreme of the effects. A, Response field in the coordinate system of temporal and spatial frequency. Each symbol indicates the response to one combination of spatial and temporal frequency, and the diameter of the symbol gives the size of the response. B, Symbols plot the response as a function of speed, where the different colors indicate gratings of different spatial frequencies. Colors are coordinated for the symbols and curves in B and the arrows in A. Error bars are the SEM firing rate. Data are taken from Priebe et al. (2003), their Figure 3A1 and B1, which also provides details of the equation used to fit the curves drawn in B.

