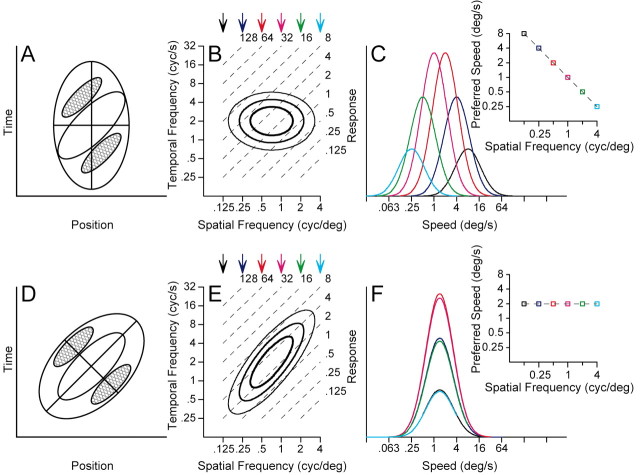
Figure 1.
Two models for the creation of motion-sensitive neural responses A, D, Response contours indicating the strength of responses as a function of the position of the stimulus and time. Red contours indicate regions of increasing response to dark stimuli, whereas blue contours indicate the response to light stimuli. The response fields in A and D are diagrams contrived to represent motion filters that would and would not have a dependence of speed tuning on the spatial frequency of sine-wave gratings. B, E, The contour lines show the receptive field of each model after transformation into Fourier space. The parallel, dashed lines indicate isospeed contours, with speed indicated by the number at the top right of each line. C, F, Each curve shows the speed tuning of the model at one spatial frequency; different colors indicate different spatial frequencies and the colors of the curves are coordinated with those of the arrows above B and E, The graphs inset at the top right of C and F plot preferred speed as a function of spatial frequency. C and F were derived exactly from the contour plots in B and E.

