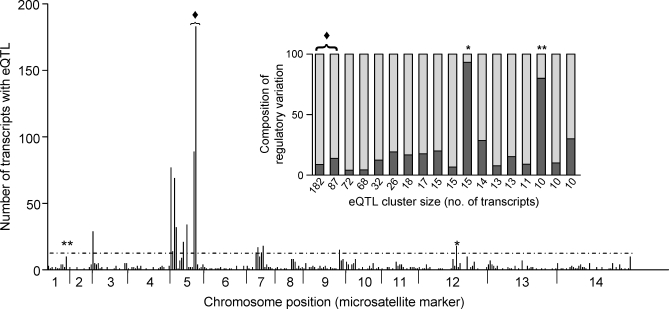
Figure 2. Genome-wide Distribution of eQTLs.
Counts of significant eQTLs are represented for each marker interval across the genome. The dashed horizontal line denotes the 95% confidence threshold for regulatory hotspots, calculated from 1,000 permutations (see Methods). Chr 5 accounted for nearly 50% of the total regulatory variation in the genome. The inset shows the composition of each cluster containing ten or more genes that mapped to the same locus, including those that surpassed the threshold for eQTL hotspots (≥14 genes). Most of these loci regulated the expression of distant genes, but two sets, denoted by one (*) and two (**) asterisks, were composed of mostly local eQTLs. These “local sets” coincide with chromosomal structural events (deletion of a locus at the end of Chr 2 [64] and an amplification event on Chr 12 [41]). The diamond (♦) denotes the two largest hotspots that aligned with the pfmdr1-containing amplicon of Dd2 on Chr 5 [41].

