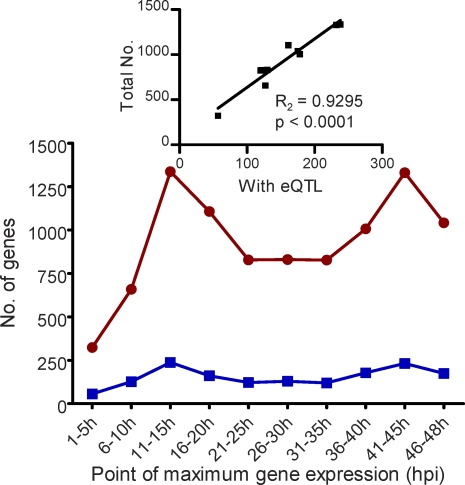
Figure 4. Genes with eQTLs as Represented by Peak Expression across the Parasite Life Cycle.
Genes whose expression peaks at defined hour intervals across the parasite life cycle (red circles) and the number of those genes that had a significant eQTLs (blue squares). The inset depicts the relationship between the two sets of gene counts, demonstrating that eQTLs were consistently found for genes whose expressions peak across the parasite life cycle and were not biased toward 18 hpi, the time at which samples were collected for this study.

