
Figure 3.
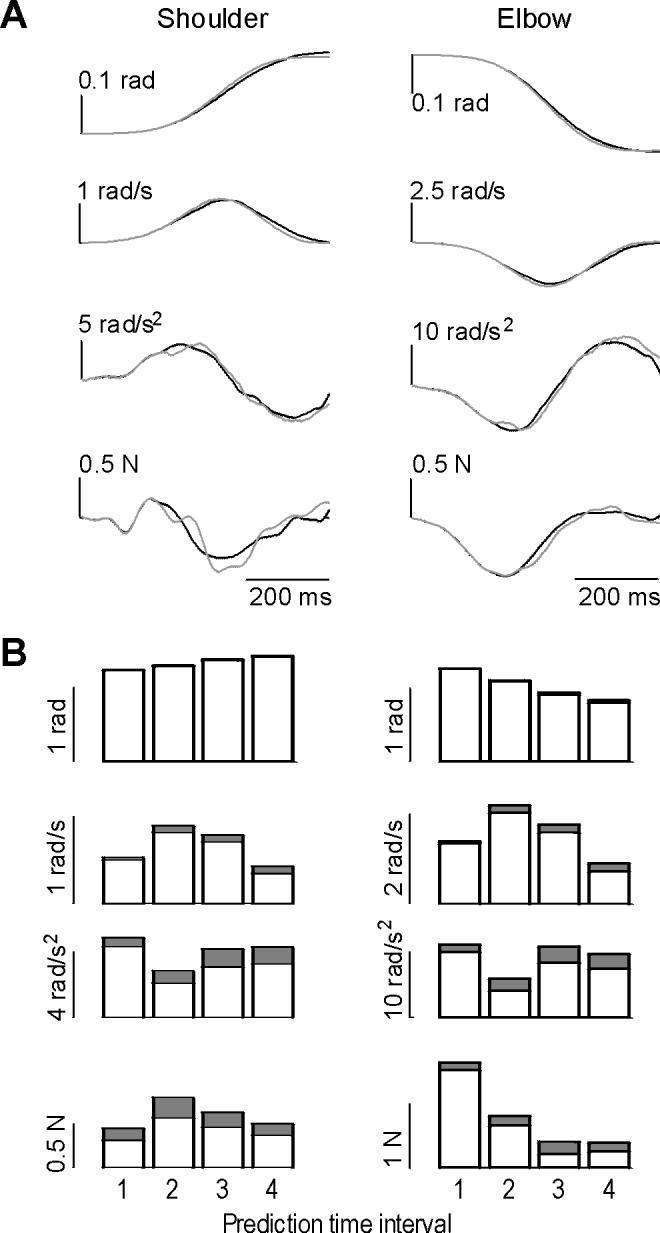
A principal component algorithm was used to parameterize trajectory of unperturbed movements during the interval 0-100 ms, and to predict the remainder of the movement’s trajectory. To evaluate the procedure, a set of unperturbed movements was divided into bases and test sets. (A) Sample movement in the test set, as predicted by the algorithm. Solid line is the measured trajectory, gray line is the predicted trajectory. (B) Performance over all movements and subjects. Average of absolute error is plotted on top of average of absolute state and force values over four intervals after movement initiation. Interval 1: 0.1-0.2. Interval 2: 0.2-0.3 ms. Interval 3: 0.3-0.4 ms. Interval 4: 0.4-0.5 ms.