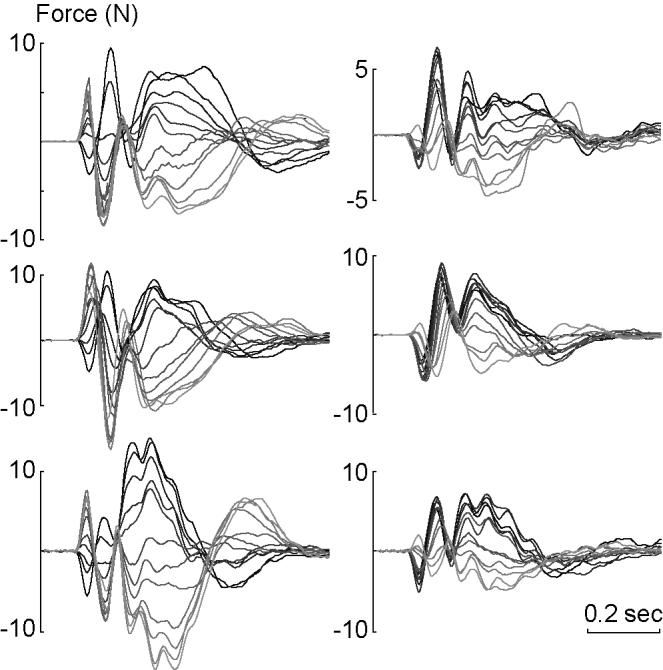
Figure 5.

Muscle response forces, x-axis component only, in the null field mo(Δq,t), and in the force field m1(Δq,t), for the three subjects. Left column: null field. Right column: force field. The response forces are plotted as the direction of perturbation vector rotates from one extreme (light gray corresponds to the far right in Fig. 2B) to another (black corresonds to the far left in Fig. 2B). Whereas the responses are symmetric in the null field, they are clustered toward positive values in the force field.
