
Fig. 4.
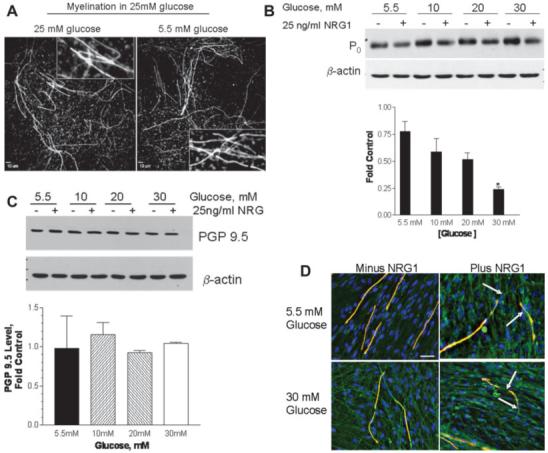
NRG-induced demyelination is not associated with axonal loss. (A) SC-DRG neuron co-cultures were myelinated in medium with 25 mM glucose and the cultures switched to fresh medium containing basal glucose concentrations of 25 or 5.5 mM for 5 days. The cells were stained with the anti-MBP antibody and nuclei were visualized with DAPI. Inset shows zoomed images of myelin segments and indicate that incubation in 5.5 mM glucose had no effect on segment morphology. Scale bar, 10 μm. (B, C) Fully myelinated co-cultures were maintained for 5 days in 5.5 mM glucose and the glucose concentration was raised to 10-30 mM. The cells were incubated for 7 days and treated with 25 ng/mL NRG1 for the final 2 days. Upper panels show representative immunoblots for the expression of P0 (B) and PGP 9.5 (C). Equivalent protein loading was demonstrated using β-actin. The intensity of the P0 and PGP 9.5 bands were normalized to β-actin and the data is expressed as a fold of the untreated (minus NRG1) control at each glucose concentration. Lower panels show densitometric quantitation of immunoblot results obtained from four experiments. Results are mean ± SEM and the asterisk indicates P < 0.01 versus control. (D) The co-cultures were treated as indicated and stained for MBP (red), PGP 9.5 (green), and DAPI (blue). The images were merged and areas of myelin loss with maintenance of axonal integrity are indicated by the arrows. Scale bar, 25 μm.