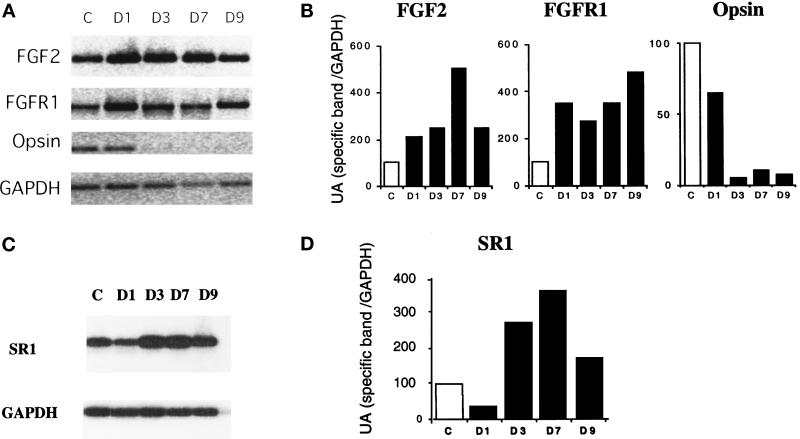
Figure 5.
Synthesis of FGF2, FGFR1, and SR1 mRNAs in the retina during retina degeneration. (A) Comparison of FGF2, FGFR1, opsin, and GAPDH mRNA levels over 9 d in light-treated rats by semiquantitative RT-PCR. Retina of nonilluminated rats was the control (c). The time of illumination, in days, is indicated on top of each lane. (B) Quantification of relative PCR products. The amount of PCR products produced was estimated by electrophoresis in an agarose gel followed by densitometry and analysis with One D scan software. (C) Comparison of SR1 and GAPDH mRNA levels over 9 d in light-treated rats by semiquantitative RT-PCR. (D and E) Comparable results were obtained in four independent experiments.

