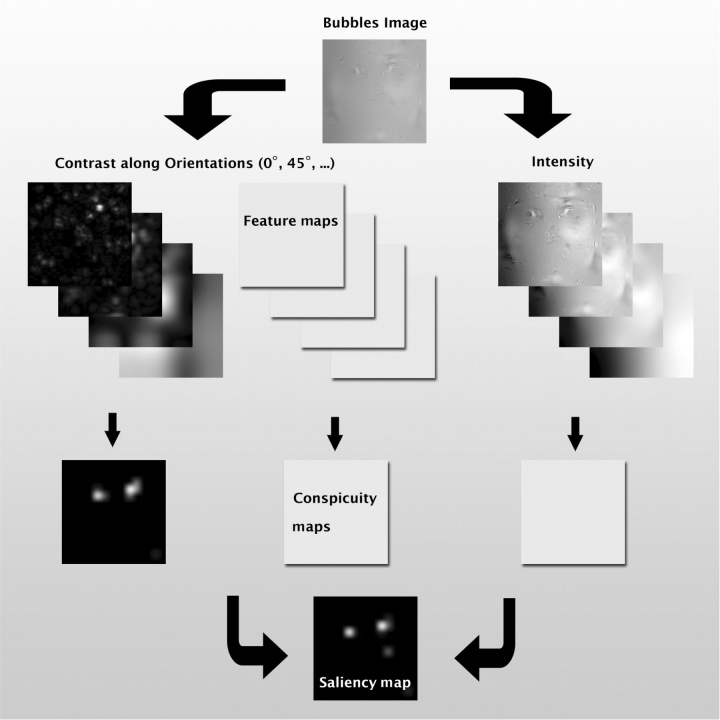
Fig. 2.
Illustration of the saliency model. Images are filtered along multiple feature dimensions (luminance, and contrast in various directions). Center–surround differences at multiple spatial scales suppress responses from homogenous regions. The resulting conspicuity maps are then linearly combined into a common map that assigns every pixel of the image a saliency value.

