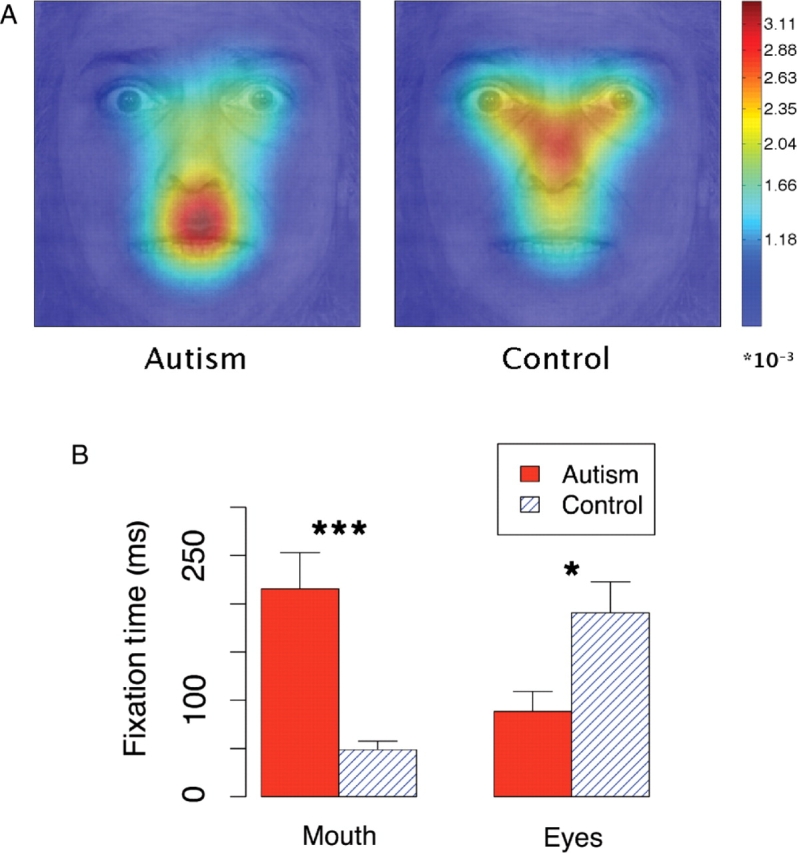
Fig. 4.

Fixations made during the first second of a bubbled face presentation. (A) Fixation density maps were calculated for fixations with an onset between 0 and 1000 ms for each individual using two-dimensional kernel-based smoothing (Venables and Ripley, 2002) and were subsequently averaged. (B) Average time spent viewing the mouth and the eyes. Error bars indicated bootstrap standard error. *P < 0.05, ***P < 0.001.
