
Fig. 6.
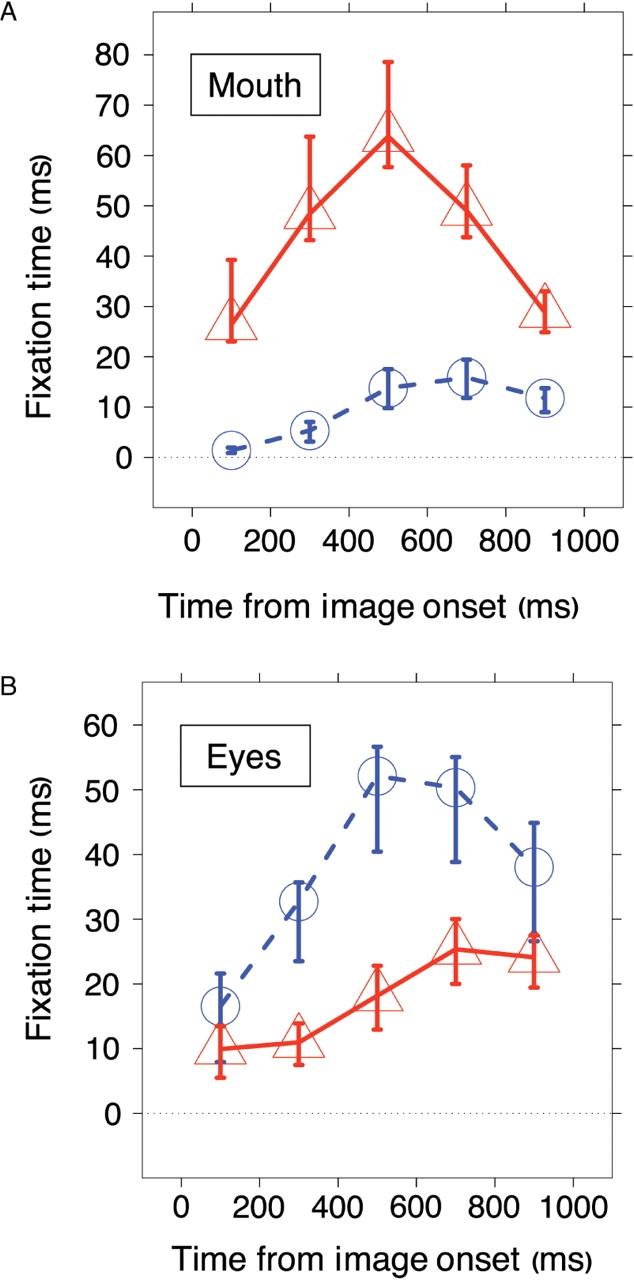
Fixation times for (A) the mouth and (B) the eyes. Viewing times of the autism group is shown in red, and of the control group in blue. Error bars indicate the bootstrap standard error.
Official websites use .gov
A
.gov website belongs to an official
government organization in the United States.
Secure .gov websites use HTTPS
A lock (
) or https:// means you've safely
connected to the .gov website. Share sensitive
information only on official, secure websites.
Fixation times for (A) the mouth and (B) the eyes. Viewing times of the autism group is shown in red, and of the control group in blue. Error bars indicate the bootstrap standard error.