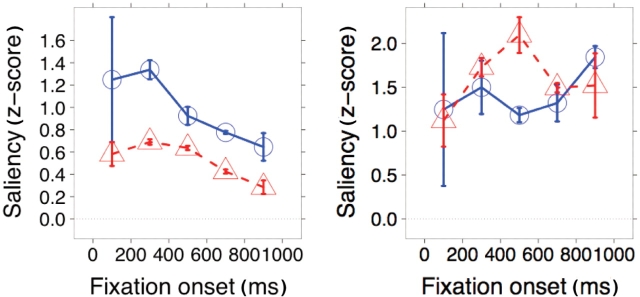
Fig. 8.
Saliency values for fixations made to the mouth (left) or eyes region of faces (right). The agreement with the saliency model is lower for people with autism (red) than for controls (blue) in the case of the mouth, but similar or even a little higher in the case of the eyes. Error bars indicate the bootstrap standard error.

