
Fig. 3.
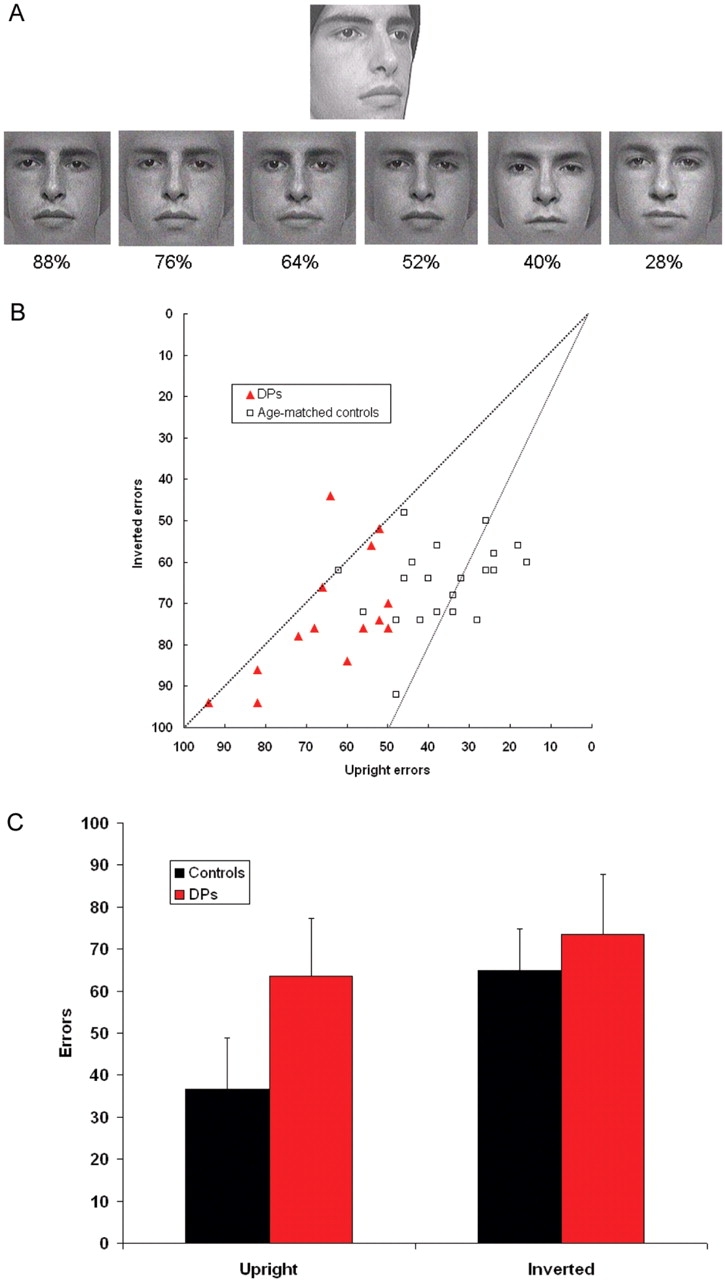
Cambridge Face Perception Test. (a) Images from an item in the Cambridge Face Perception Test. The six frontal shots are presented in a random order and must be sorted by their similarity to the target image (the 3/4 profile view). Numbers under each image indicate the percentage of the target face in the image. Note that each image is morphed with a different exemplar. (B) DP and control scores on the CFPT. DPs score more poorly with the upright sort than controls, but score similarly with inverted sorts. The dashed line running from corner to corner indicates equivalence with upright and inverted sorting. The smaller dashed line displays the position at which subjects made twice as many inverted errors as upright errors. (C) Average errors for controls and DPs with the upright and inverted CFPT sorts. Error bars show one standard deviation. Controls show a large inversion effect while DPs performed only slightly better with upright faces than with inverted faces.