
Fig. 6.
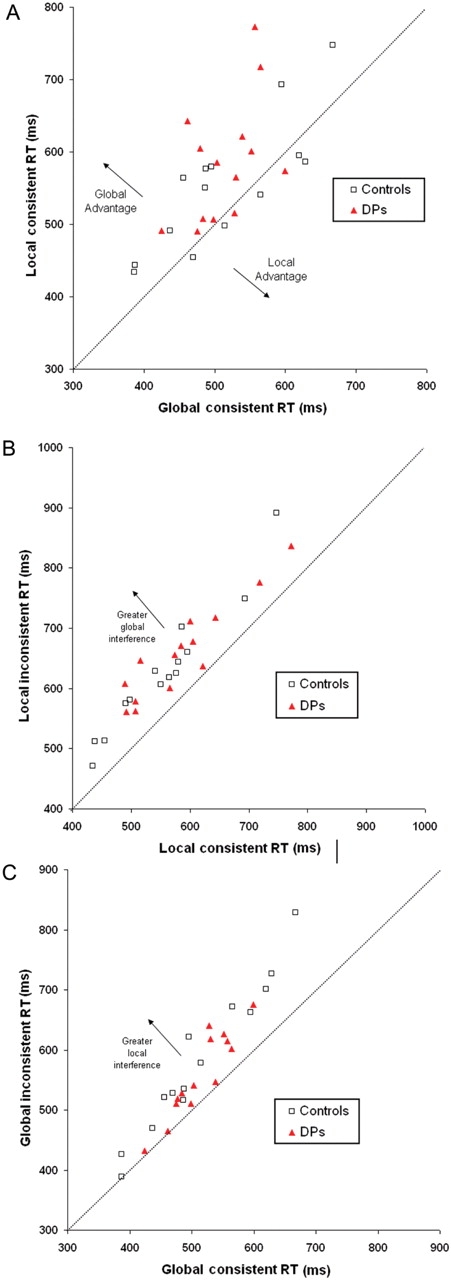
Individual RTs of DPs and controls on the global–local task. Each point represents one participant. (A) Comparison of average RTs on global consistent trials and local consistent trials. (B) Comparison of average RTs for local consistent and inconsistent trials. (C) Comparison of average RTs for global consistent and inconsistent trials.