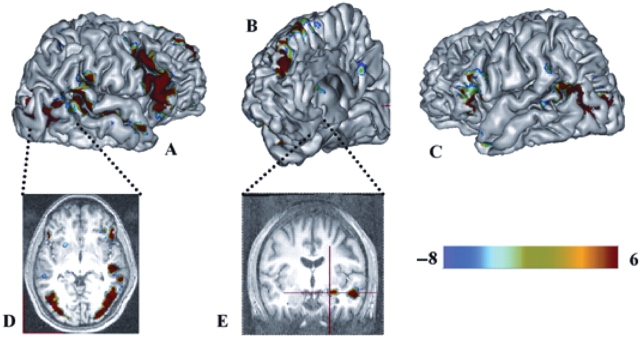
Fig. 1.
Brain activation clusters associated with explicit judgment of emotional expressions in the control group. Clusters are superimposed on a 3D anatomical image. (A) and (C), Lateral view; (B), Mid sagittal view; (D), Transverse view; (E), Coronal view. The clusters are colour-coded based on the Emotion-minus-Age t-statistic values (positive values indicate Emotion greater than Age). For graphical reporting significant activation effects are shown thresholded at an uncorrected threshold of P < 0.001.

