Figure 1.
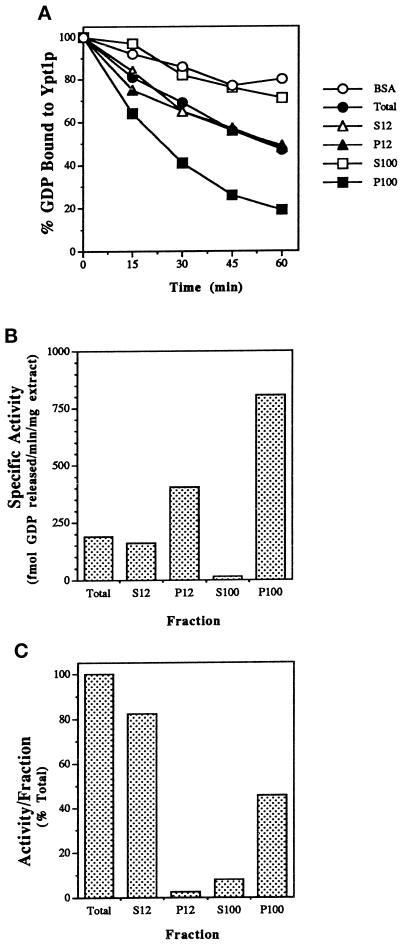
Identification of a GDP release-stimulating activity for Ypt1p in the P100 fraction of yeast cells. (A) Time course of GDP release from Ypt1p in the presence of fractionated yeast extracts is shown. Ypt1p-[3H]GDP was incubated in the presence of cell extract or BSA at 1 mg/ml. Values represent the percent of label retained at the indicated time, relative to that at the beginning of the incubation. Fractions are the total extract (closed circles), S12 (open triangles), P12 (closed triangles), S100 (open squares), P100 (closed squares), and no extract (BSA; open circles). (B) Ypt1p-GEF is enriched in the P100 fraction. To determine the specific activity of GDP release in the different fractions, we varied the fraction concentration from 0.2 to 1 mg/ml in the GDP release reaction and withdrew samples at 3 min intervals over 15 min. Conditions were selected under which protein and time were limiting, and rates of GDP release were determined from the linear portion of the curve. (C) The P100 fraction contains approximately one-half of the Ypt1p-GEF activity in the total extract. The portion of activity per fraction was calculated as the product of the specific activity (Figure 1B) and amount (milligrams) of protein in the fractions obtained from ∼5000 OD600 units of cells. Results shown in this figure are representative of at least three experiments, and values from similar experiments agreed to within 5%.

