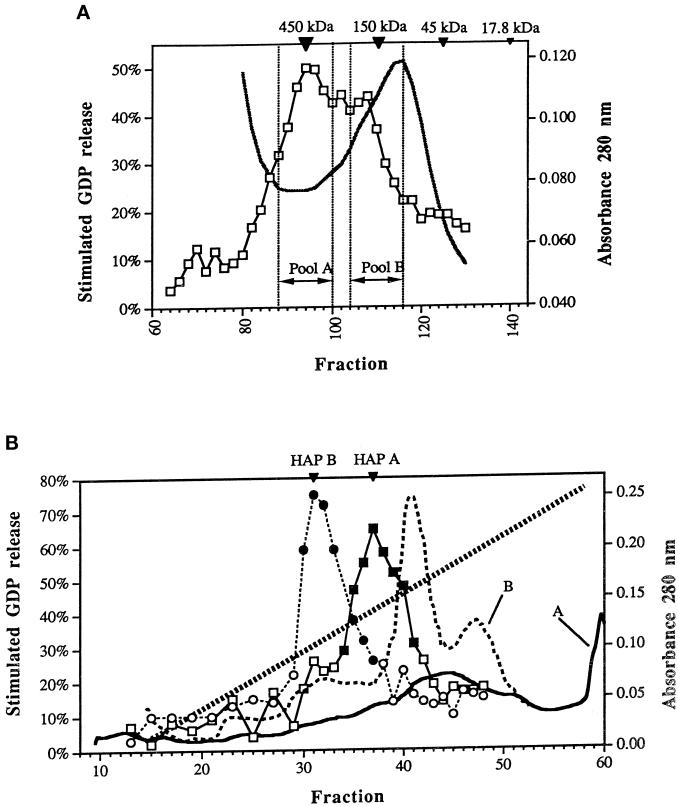
Figure 5.
Partial purification of the Ypt1p-GEF. (A) Gel filtration column. Two partially overlapping Ypt1p-GEF peaks are collected into distinct pools. The solubilized GEF fraction (Det-P100 extracted by salt) was separated on a Sephacryl S-300 HR column. Stimulated GDP loss at 30 min is graphed versus fraction number (squares). Protein concentration in the fractions as determined by absorbance at 280 nm is plotted (solid black line). The inverted triangles at the top show the positions of ferritin (450 kDa), alcohol dehydrogenase (150 kDa), ovalbumin (45 kDa), and myoglobin (17.8 kDa). Pool A and Pool B were collected separately for further analysis and purified and concentrated as described in MATERIALS AND METHODS. The chromatogram represents the average of three independent experiments performed under identical conditions. (B) HAP column. The S-300 A and S-300 B pools generate single, distinct peaks of Ypt1p-GEF activity on the hydroxyapatite column. The S-300 pool A and the S-300 pool B were loaded onto separate ceramic hydroxyapatite columns and eluted with a phosphate gradient. The results shown are the stimulated GDP loss at 30 min in fractions from the HAP column loaded with the S-300 A pool (squares), the absorbance at 280 nm of the HAP column loaded with the S-300 A pool (solid line), the stimulated GDP loss at 30 min in fractions from the HAP column loaded with the S-300 B pool (circles), and the absorbance at 280 nm of the HAP column loaded with the S-300 B pool (black dotted line). The phosphate gradient (from 10 to 200 mM) is indicated by the diagonal dotted line. Fractions with significant guanine nucleotide exchange activity (filled symbols) were combined into HAP A or HAP B pools (indicated by the inverted triangles at the top). The results represent two independent experiments.

