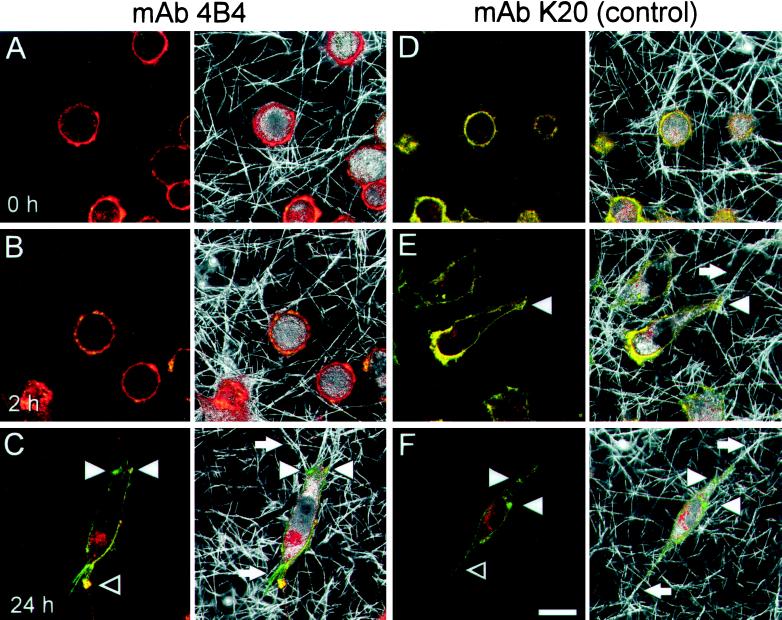
Figure 3.
Distribution of β1 integrins (left) and corresponding interactions with collagen fibers (right) after incubation with blocking mAb 4B4 and nonblocking mAb K20. MV3 cells were incubated with mAb 4B4 (A–C) or nonblocking mAb K20 (D–F), additionally stained with LRSC-conjugated F(ab)′ fragments (red fluorescence), washed, and subsequently embedded into the collagen lattice. Samples were incubated for 0 h (A and D), 2 h (B and E), or 24 h (C and F) at 37°C, fixed, and stained again with FITC-conjugated anti-β1 integrin mAb 4B4 (green fluorescence). Red color (A and B) indicates low secondary staining intensity by green mAb 4B4 caused by previous occupation of existing epitopes by 4B4–LRSC conjugates. Yellow color (D and E) indicates the superimposition of K20 (red) and 4B4 staining (green) detecting different epitopes on the β1 chain. Bar, 20 μm.

