
Figure 2.
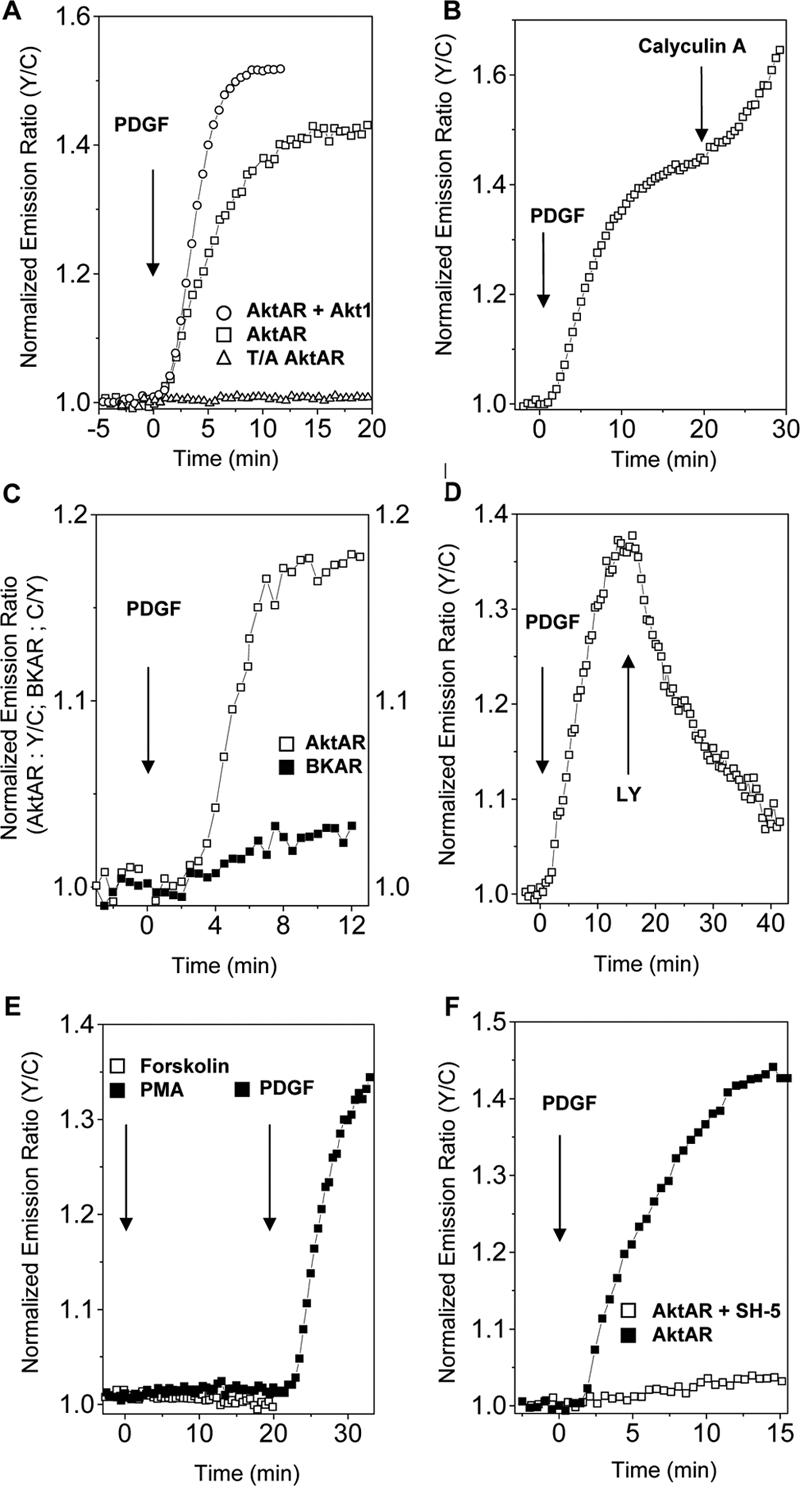
Characterization of AktAR. (A) Representative time courses show the response of overexpressed AktAR in serum-starved NIH 3T3 cells upon 50 ng/ml PDGF stimulation, with (n = 5) or without (n = 7) overexpression of Akt1. Representative response of the AktAR-T/A mutant is also shown (n = 3). (B) A representative time course shows the response of AktAR in serum-starved NIH3T3 cells stimulated by 50 ng/ml PDGF, followed by treatment with 5 nM Calyculin A (n = 2). (C) Representative time courses of AktAR (n = 3) and BKAR (n = 3) in unstarved NIH 3T3 cells stimulated with 50 ng/ml PDGF. (D) Reversibility of AktAR. A representative time course shows the response of AktAR in NIH 3T3 cells stimulated with 50 ng/ml PDGF, followed by 20 μM LY294002 (n = 3). (E) AktAR is insensitive to PKC and PKA activation. NIH3T3 cells were treated with either 50 ng/ml PMA, followed by 50 ng/ml PDGF (n = 4) or 50 μM forskolin (n = 3). (F) Specificity of AktAR. Representative time courses show the response of AktAR in NIH 3T3 cells stimulated with 50 ng/ml PDGF in the absence (n = 4) and presence (n = 5) of 6 μM SH-5.